No, here the widths of the rectangles are varying, so we need to make certain modifications in the length of the reactanlges so that the areas are proportional to the frequencies. We proceed as follows
1. Select a class interval with the minimum class size, here the minimum class is 20.
2. The length of the reactangles are then modified to be proportionate to the class size 20.
Now, we get the following modified table.

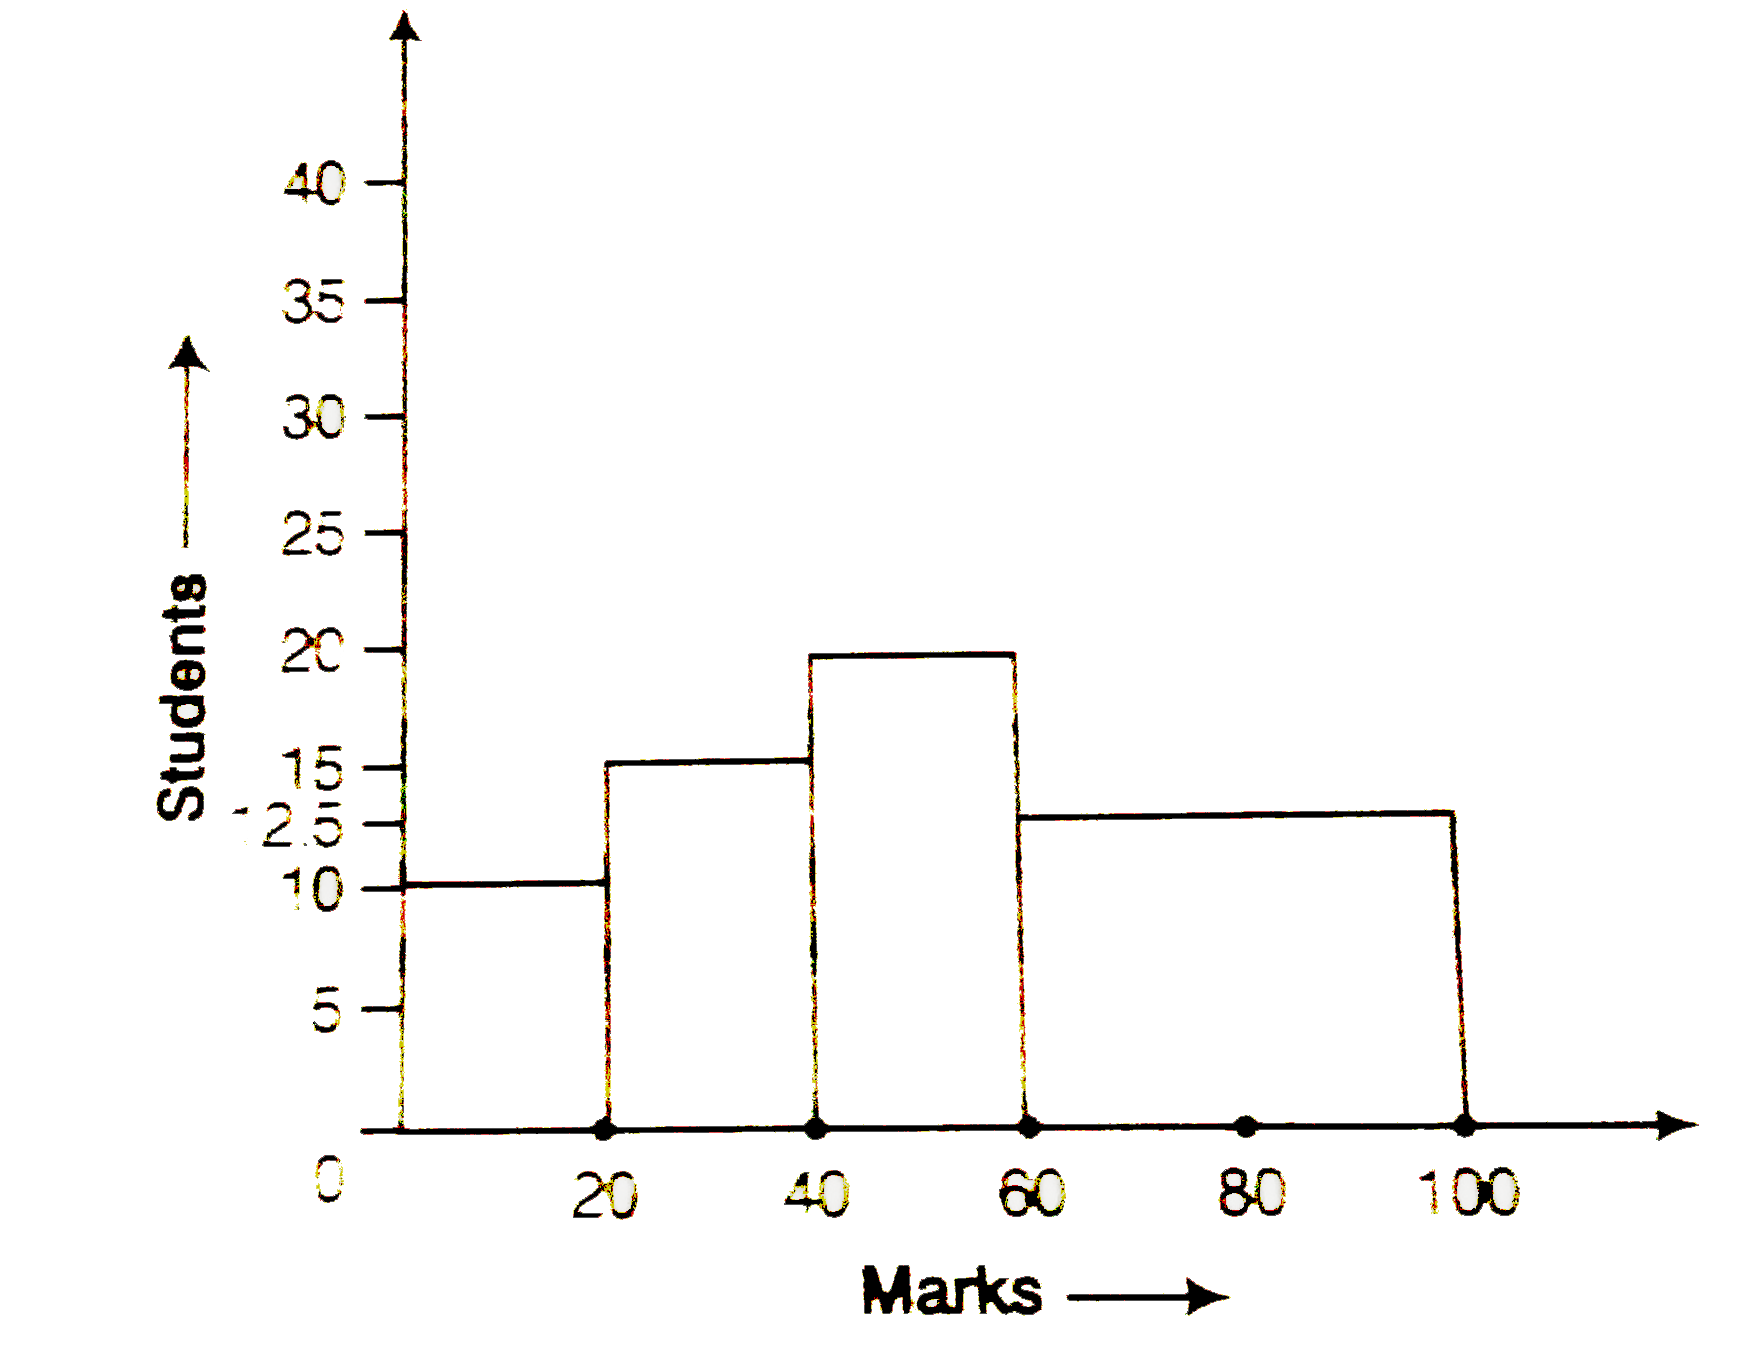
So, the correct histogram with varying width is given below.