Drawing the plot
Explaining the process of Nuclear fission and Nuclear fusion
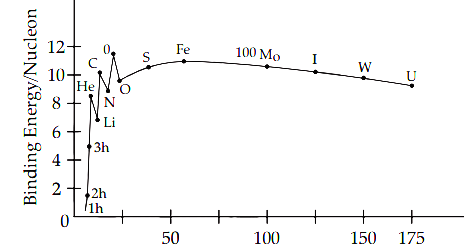
The plot of (B.E / nucleon) verses mass number is as shown.

[Note : Also accept the diagram that just shows the general shape of the graph].
(i) During nuclear fission
A heavy nucleus in the larger mass region ( A>200) breaks into two middle level nuclei, resulting in an increase in B.E/ nucleon. This results in a release of energy.
(ii) During nuclear fusion
Light nuclei in the lower mass region (A<20 ) fuse to form a nucleus having higher B.E / nucleon. Hence Energy gets released.
[Alternatively: As per the plot: During nuclear fission as well as nuclear fusion, the final value of B.E/ nucleon is more than its initial value. Hence energy gets released in both these processes. ]
Detailed Answer
Plot of binding energy per nucleon is shown in Figure. From B–E/nucleon curve, we note that first B.E. increases rapidly and then decreases slowly and B.E is max i.e. 8.8 Mev for 56Fe atom. Again by decreasing slowly B.E. become 8.5 Mev for uranium atom 23892U.
This shows that nucleus with mass number A < 20 areless stable, but some nucleus as 4He, 12C, 16O (even–even) nuclei are stable. Thus the nuclei with mass number A < 20 shows fusion reaction as 2H and 3H have very low B-E/nucleon in comparison to 4He. Thus when two very light nuclei (A >10 say) fuse to form a heavy nucleus, the B.E/A of fused heavier nucleus is more than the B.E/A of lighter nuclei. This implies release of energy in nuclear fusion. Similarly, due to fission of a very heavy nucleus, the B.E/A of the product as daughter nuclei increases which implies the release of huge amount of energy. Thus for lighter nuclei nuclear fusion and for heavier nuclei nuclear fission takes place and huge amount of energy is released.