Distribution in data science is a method which shows the probable values for a variable and how often they occur.
While the concept of probability gives us the mathematical calculations, distributions help us actually visualize what is happening underneath.
For example, consider a coin which has two sides, head and tail. Now when you throw the coin up in the air, what is the probability of getting a head? It is ½ or half right? And what is the probability of getting a tale? It is again 1/2 or half. However, if you say, what is the probability of getting a 3rd side on coin? Isn’t it NIL? It is impossible to get a third side on the coin which has only two sides, head and tale. Thus probability is zero.
The distribution of an event consists not just the input values that can be seen, but made up of all possible values.
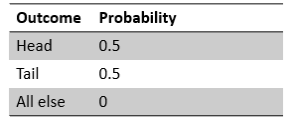
So, the distribution of the event, tossing the coin will be given by the following table. The probability of getting the head is 0.5. The probability of getting the tail is 0.5 and so on. You can be sure that you have exhausted all the values when the sum of probabilities is equal to 1% to 100%. For all other values apart from this, the probability of occurrence is zero.
Probability Table for Tossing a coin
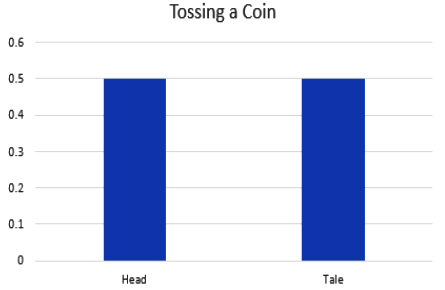
Every probability distribution is associated with a graph which describes the likelihood of occurrence of each event. Below graph represents our example. This type of distribution is called as a Uniform Distribution.
Uniform Distribution Graph for Tossing a coin
However, point to note over here is that distribution in statistics is defined by underlying probabilities and not by the graph. Graph is just a visual representation. We had studied topic of data visualization in the previous grade.
Probability Table for Tossing two coin
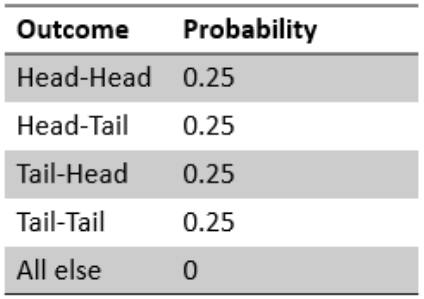
Now, let us extend our problem statement to tossing two coins. What are the possibilities over here? Head-Head, Head-Tail, Tail-Tail and Tail-Head. Below is the table of all possible combinations.
Let us now understand the probability distribution for this scenario. Look at the below graph.
By looking at the graph we can understand that probability of getting a head in both the coins is 0.25. Similarly, getting a head in one coin and tail in another coin is 0.25. Probability of getting tail in one coin and head in another coin is 0.25. And probability of getting a tail in both the coins is 0.25. Thus, the graph of probability distribution in this case should look as shown in Fig.
Uniform Distribution Graph for Tossing two Coins


