The simultaneous shifts can happen in four possible ways:
1. Both supply and demand curves shift rightwards.
2. Both supply and demand curves shift leftwards.
3. Supply curve shifts leftward and demand curve shifts rightward.
4. Supply curve shifts rightward and demand curve shifts leftward. The simultaneous shifts of demand and supply curve in perfect competition can be represented in the following table:

In the above table, each row of the table describes the direction in which the equilibrium price and quantity will change for each possible combination of the simultaneous shifts in demand and supply curves. For instance, from the second row of the table, we can notice that due to a rightward shift in both demand and supply curves, the equilibrium quantity increases invariably but the equilibrium price may increase or decrease, or remain constant. The following diagrams depict the second and third cases of the above table:
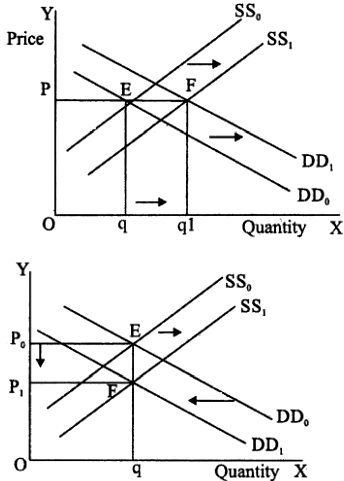
In the above diagram (a) initially, the equilibrium is at E where the demand curve DD0 and supply curve SS0 intersect. Here, both supply and demand curves shift rightward where the price remains constant at P but the equilibrium quantity moves from q to q1.
Similarly, in diagram (b), the supply curve shifts rightward and demand curve shifts leftward where the equilibrium quantity remains same but the equilibrium price decreases from P to P1. Therefore, the rightward shifts in both demand and supply curves leads to increase in the equilibrium quantity and equilibrium price remaining constant. The equilibrium quantity remains same and the price decreases if there is leftward shift in demand curve and a rightward shift in supply curve.


