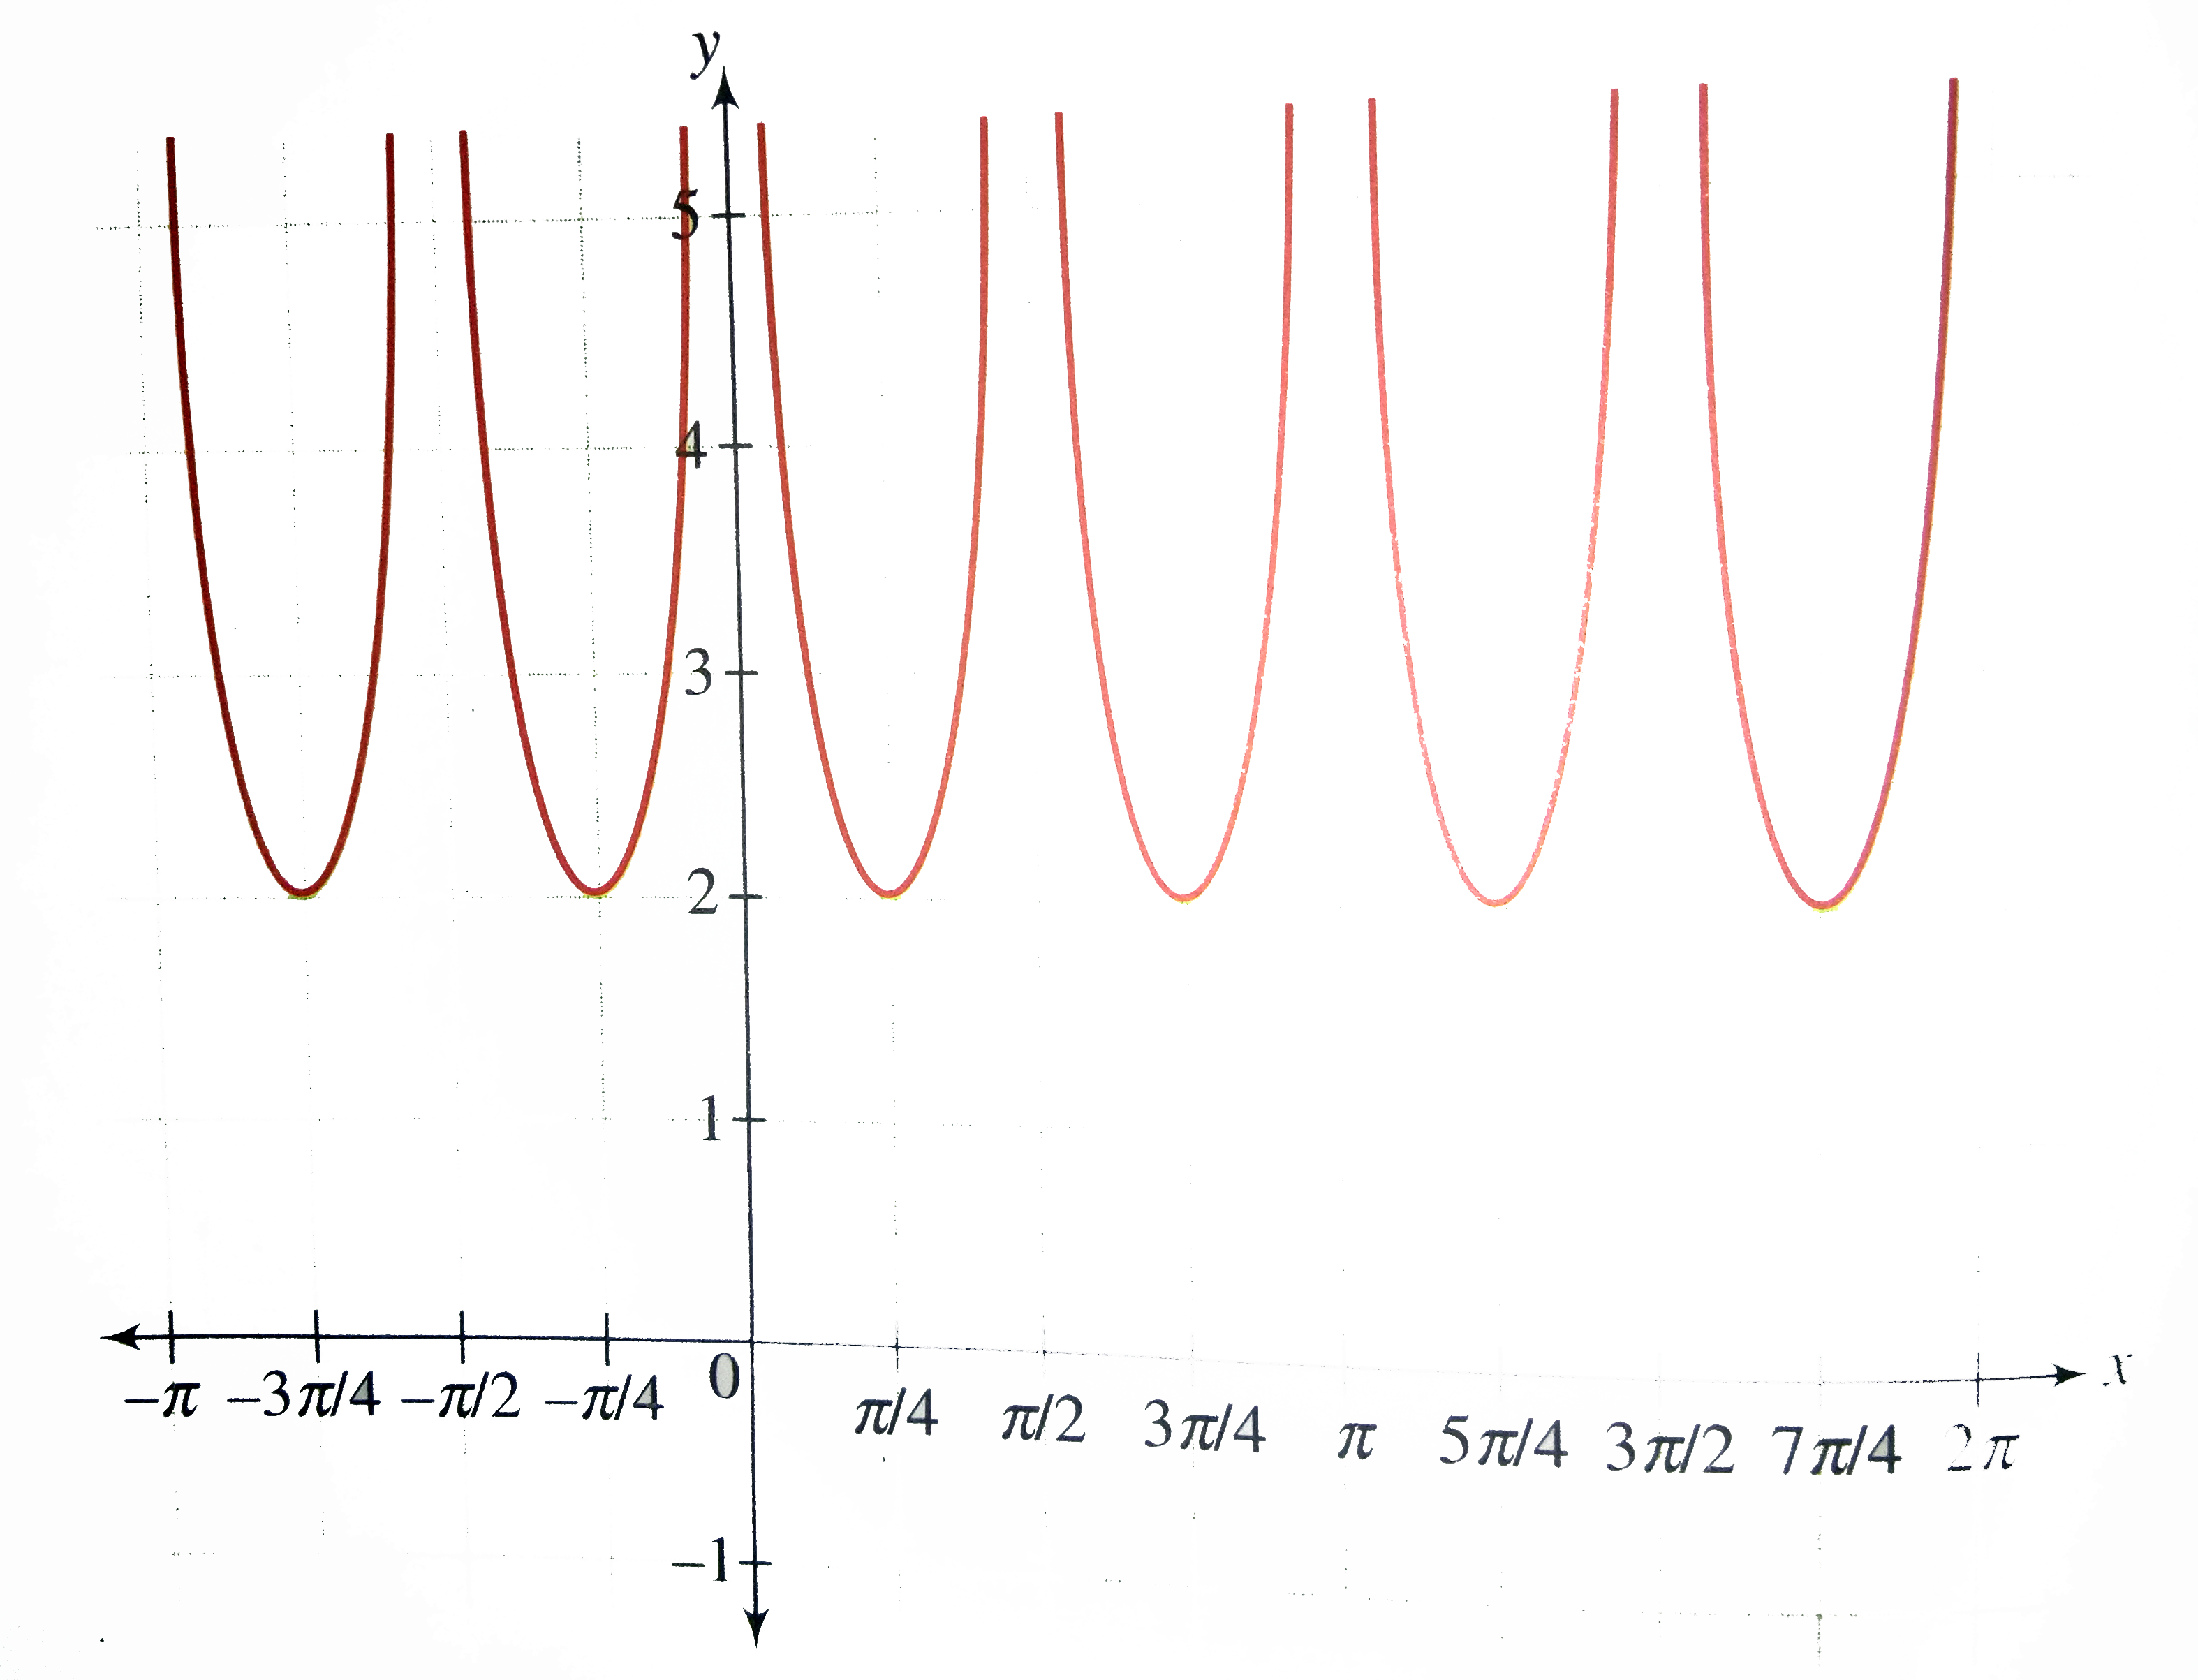
We have `y = f(x) = |tan x| + |cot x|`
Clearly, the domain of the function is `R - {(npi)/(2), n in Z}.`
`f(x + (pi)/(2)) = f(x)`
So the period of `y = f(x)` is `(pi)/(2)`.
We need to draw the graph of the function for `x in (0, (pi)/(2))`.
`f(x) = tan x + cot x = (1)/(sin x cos x) = (2)/(sin2x)` for `x in (0, (pi)/(2))`
`underset(x to 0)lim (tan x + cot x) = underset(x to (pi)/(2))lim (tan x + cot x) = oo`
and `f_(max.)(x) = 2`, when sin 2x = 1 or `x = (pi)/(4)`
Thus, the graph of the function for `x in (0, (pi)/(2))` is as follows.

Since the period of `y = f(x)` is `pi//2` the graph is repeated as shown in the following figure.