Use app×
QUIZARD
QUIZARD
JEE MAIN 2026 Crash Course
NEET 2026 Crash Course
CLASS 12 FOUNDATION COURSE
CLASS 10 FOUNDATION COURSE
CLASS 9 FOUNDATION COURSE
CLASS 8 FOUNDATION COURSE
0 votes
107 views
in Physics by (25.6k points)
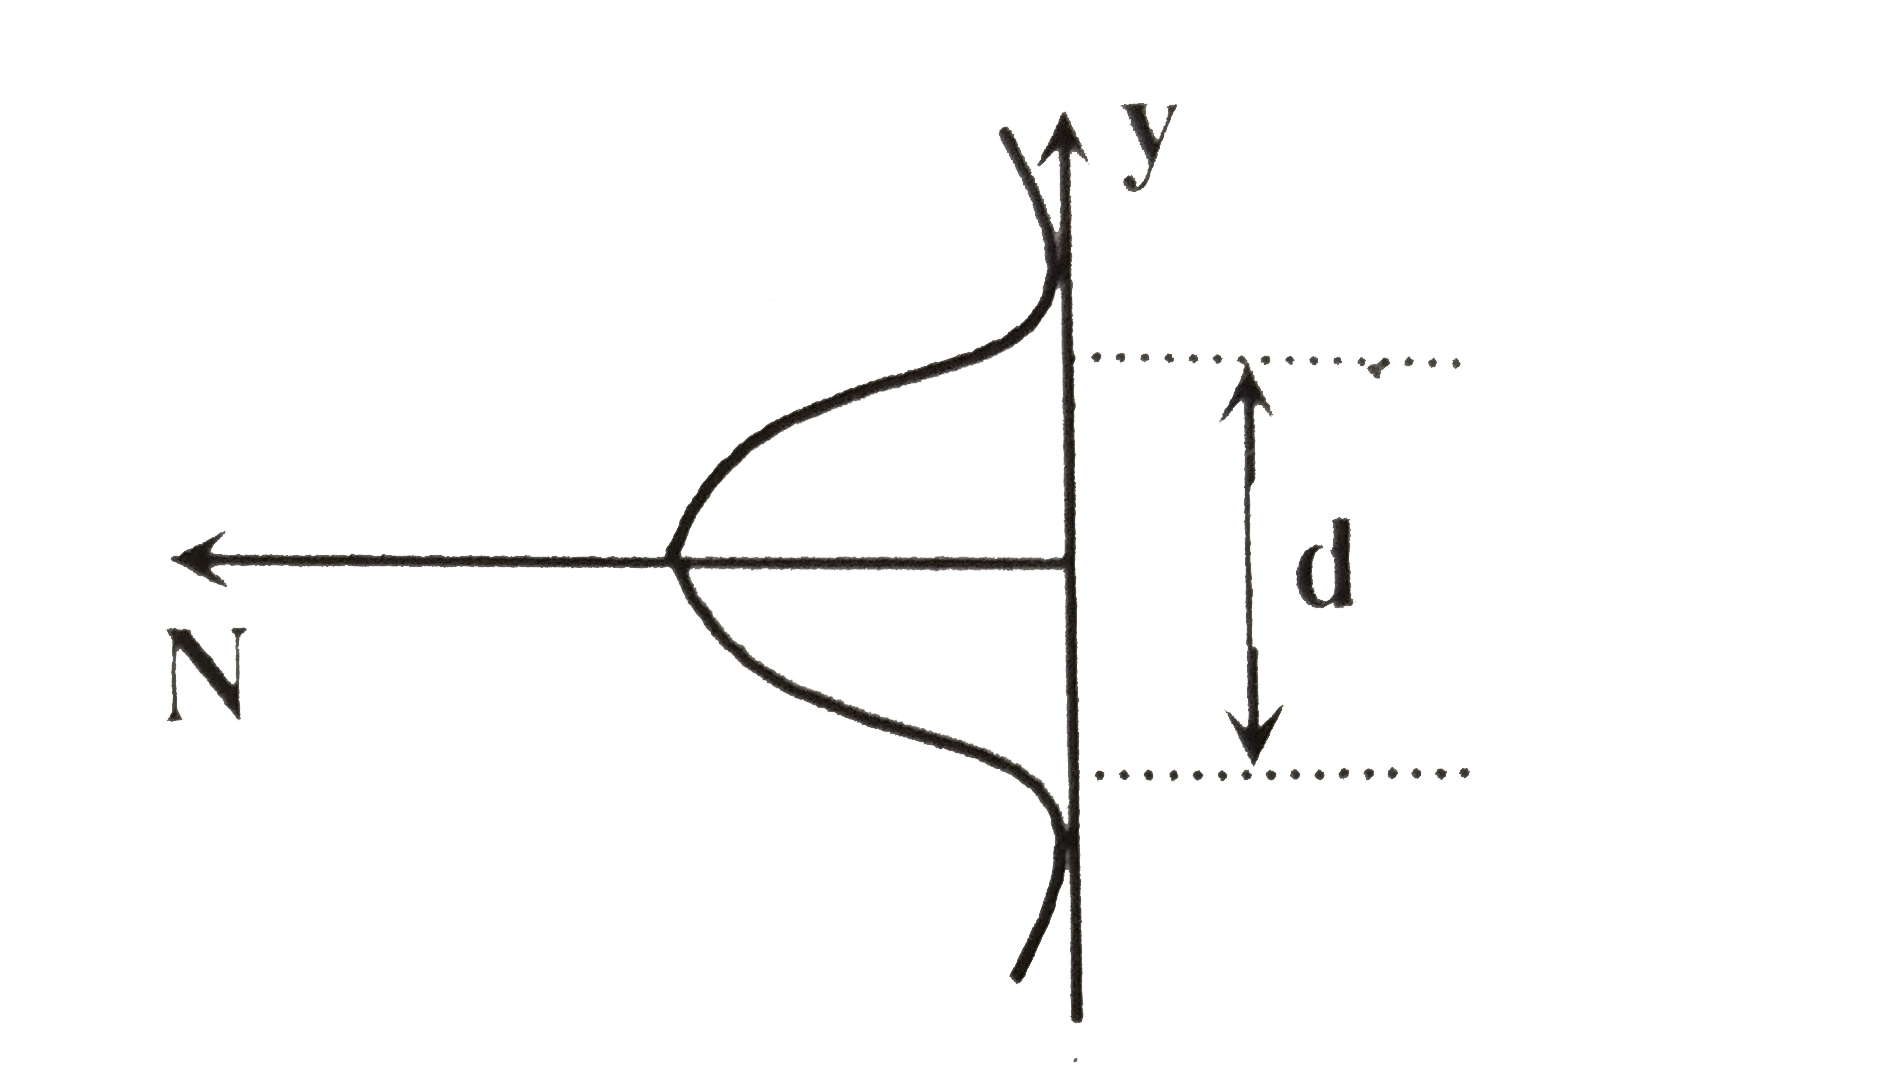
In an experiment, electrons are made to pass through a narrow slit of width `d` comparable to their de Broglie wavelength. They are detected on a screen at a distance `D` from the slit (see figure)`.
`
image
Which of the following graphs can be expected to represent the number of electrons `N` detected as a function of the detector position `y` (y=0 corresponds to the middle of the slit ).
A. image
B. image
C. image
D. image

Please log in or register to answer this question.

Welcome to Sarthaks eConnect: A unique platform where students can interact with teachers/experts/students to get solutions to their queries. Students (upto class 10+2) preparing for All Government Exams, CBSE Board Exam, ICSE Board Exam, State Board Exam, JEE (Mains+Advance) and NEET can ask questions from any subject and get quick answers by subject teachers/ experts/mentors/students.

Categories

...